Full Corpus
Statistics for the TLG corpus as a whole.
The Statistics page provides several ways to explore patterns of word use in the TLG corpus. Use the menu at the top of the page to choose one of three views:
Statistics for the TLG corpus as a whole.
Statistics for a selected author or work.
Statistics for a particular lemma.
The page combines a summary panel, expandable sections, charts, word clouds, and—where appropriate—a geographic display. Many entries in the summary and expandable lists are links that lead to related TLG information or searches.
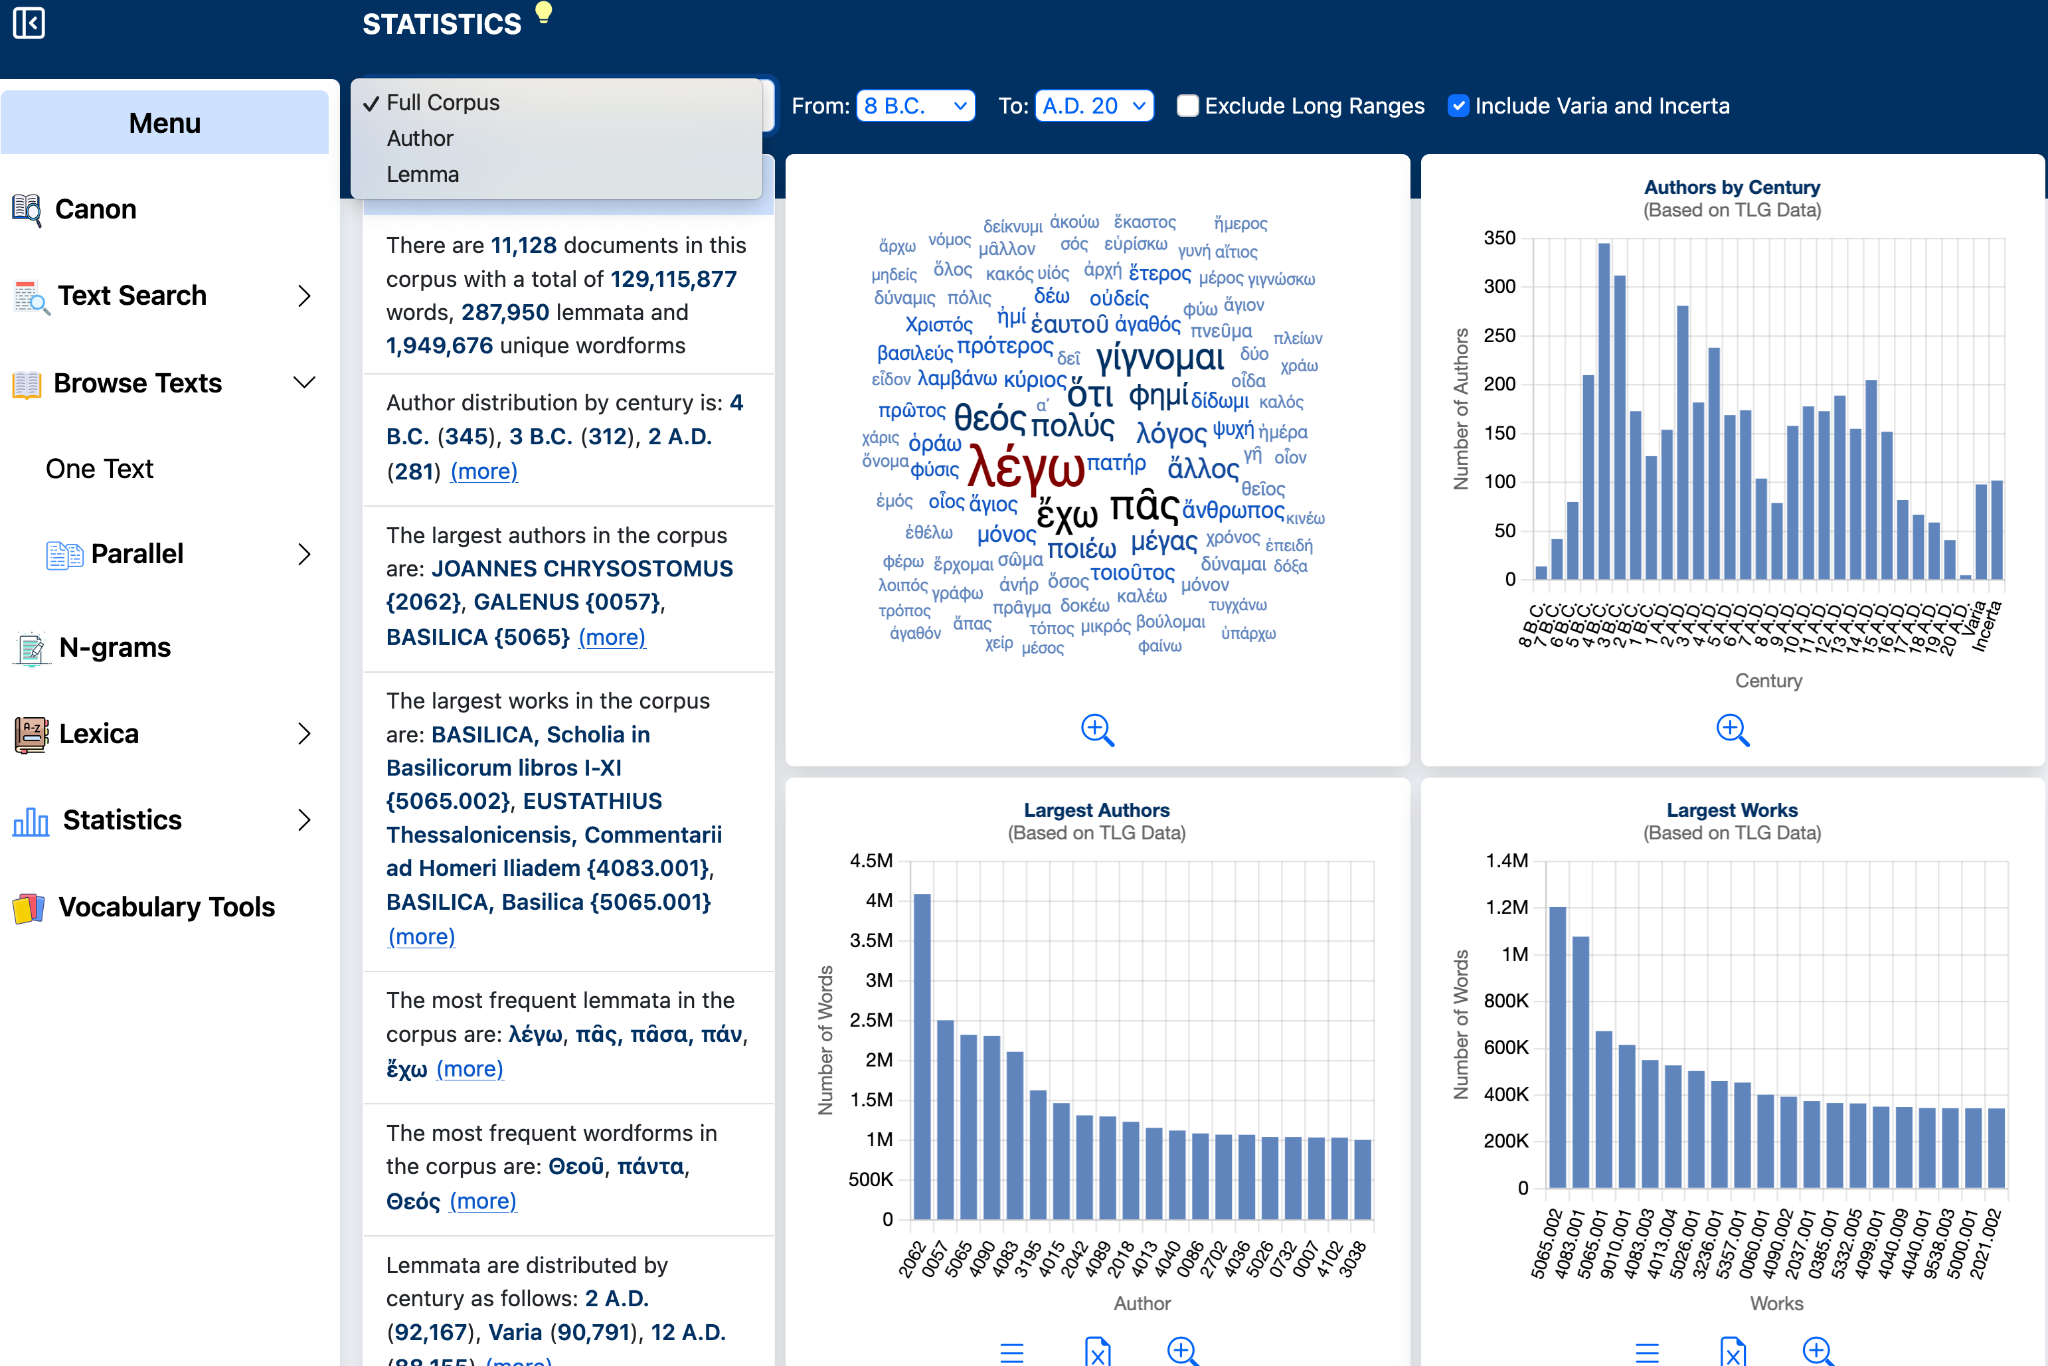
Select Full Corpus to view an overview of the contents and chronological distribution of the TLG corpus. The Summary panel reports corpus-wide information such as the number of documents, words, lemmata, and unique wordforms, together with selected information about authors, works, and frequently occurring vocabulary.
The visualizations include a corpus word cloud and charts such as Authors by Century, Largest Authors, and Largest Works. Expandable sections in the Summary panel provide additional corpus statistics.
The century controls at the top allow you to examine a selected chronological portion of the corpus rather than the entire date range.
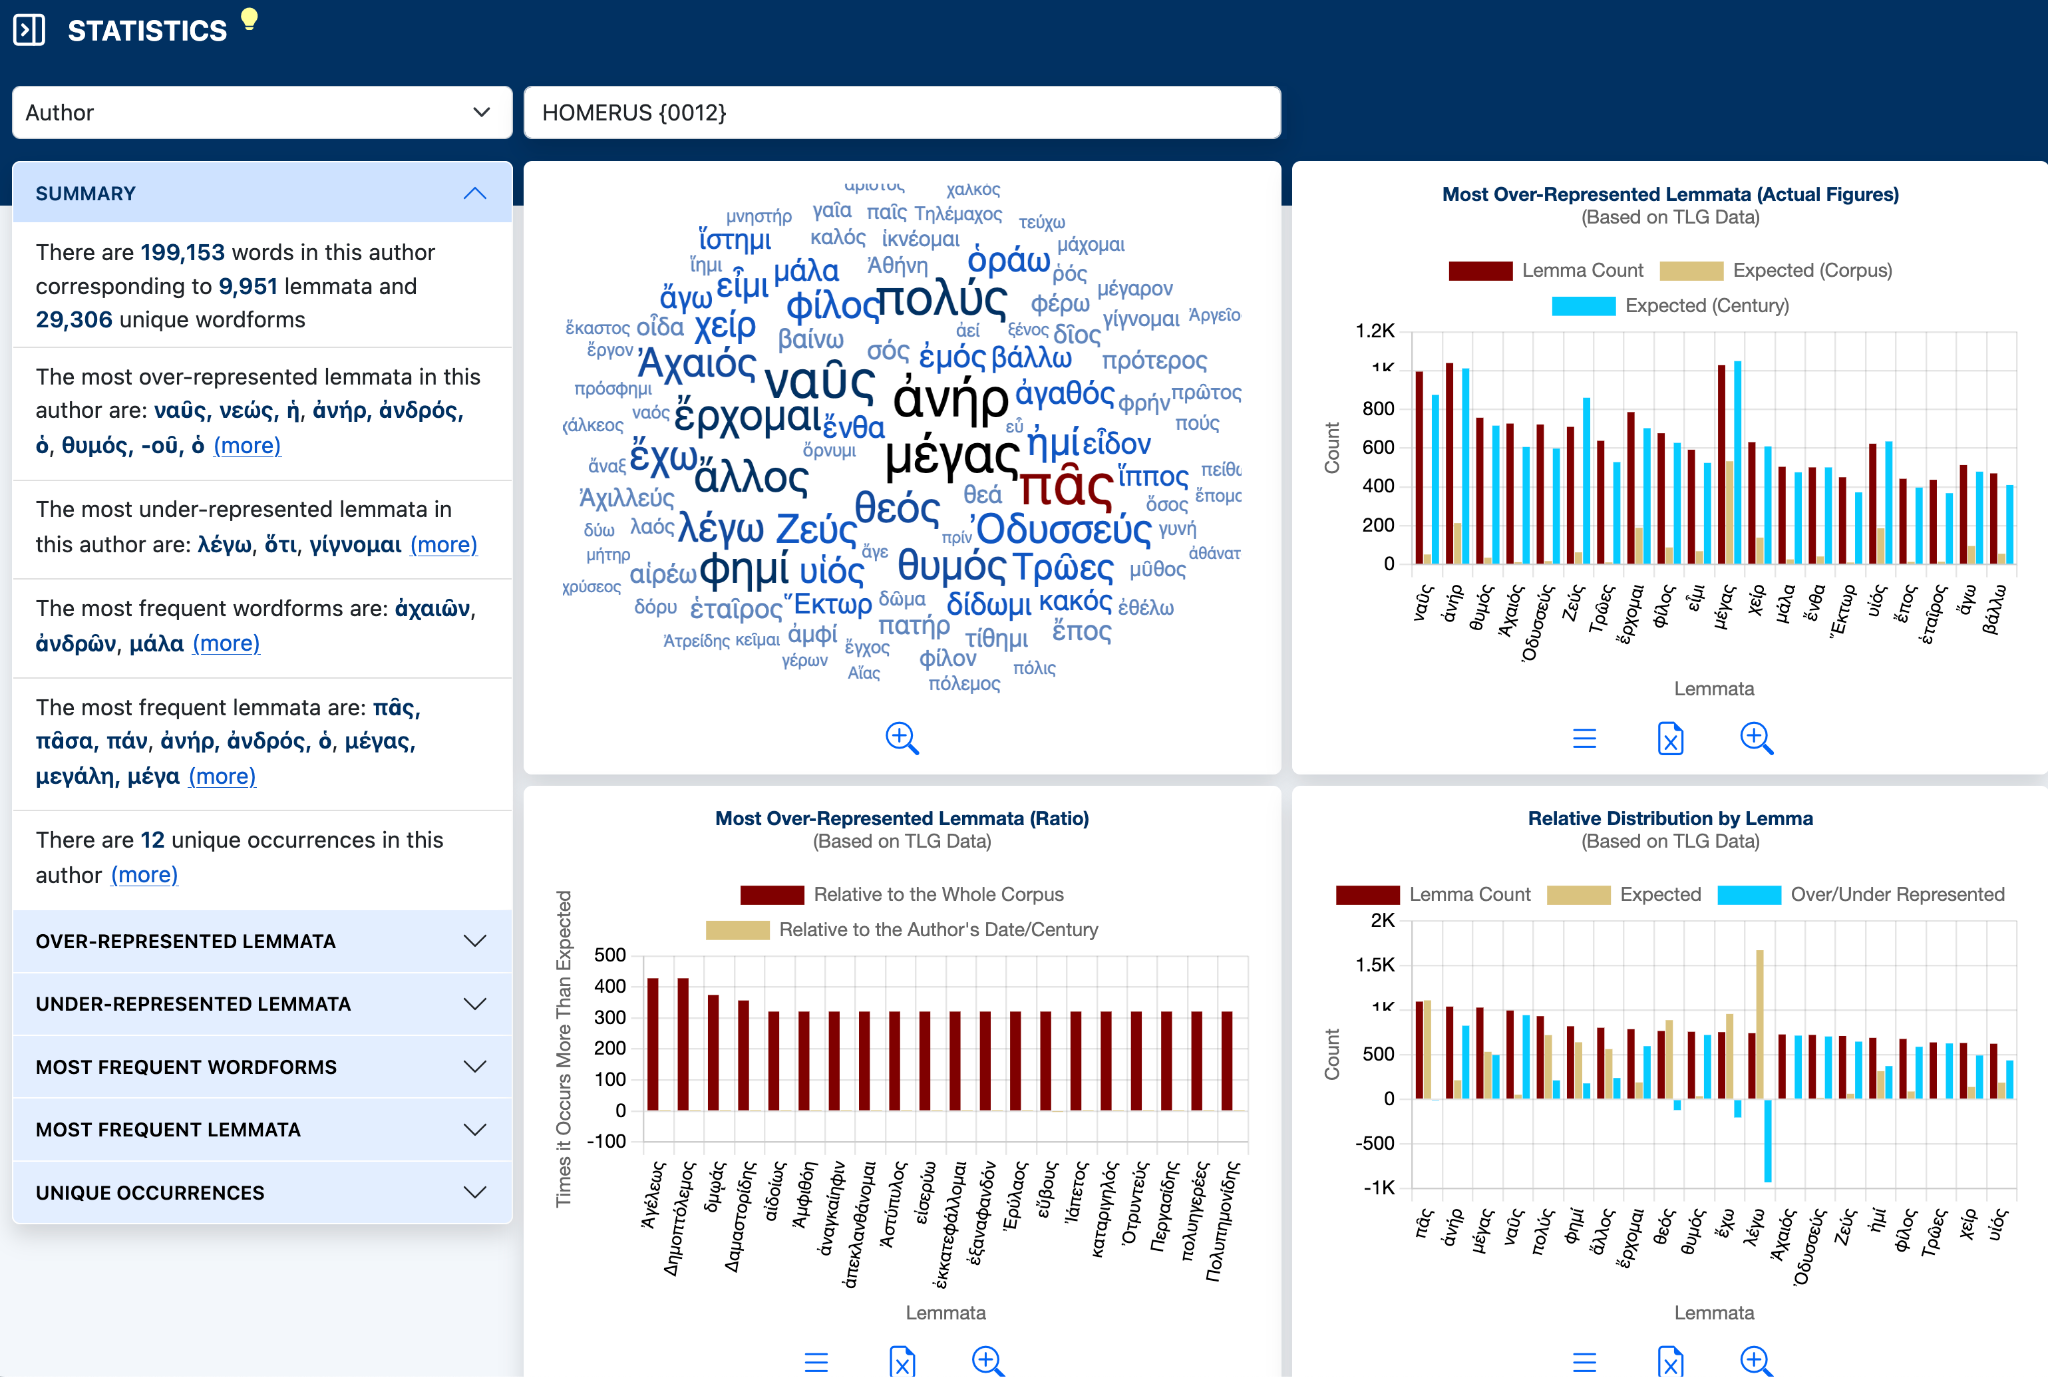
Select Author and enter an author to view statistical information for that author. The Summary panel gives an overview of the selected author's vocabulary and includes links to more detailed lists.
The display includes a word cloud and charts devoted to vocabulary patterns. These include Most Over-Represented Lemmata (Actual Figures), Most Over-Represented Lemmata (Ratio), and Relative Distribution by Lemma.
The expandable sections on the left include Over-Represented Lemmata, Under-Represented Lemmata, Most Frequent Wordforms, Most Frequent Lemmata, and Unique Occurrences.

Select Lemma, enter the lemma, and choose the input language. The Summary panel reports the total number of attestations in the selected corpus and identifies periods, authors, and works in which use is especially high.
The charts show both raw and relative patterns of use. Distribution by Century displays the number of occurrences in each century, while Highest Use by Author displays authors with the largest numbers of occurrences. Related charts compare actual counts with expected counts so that unusually high or low representation can be seen in context.
Use the expandable sections on the left to move directly to Distribution by Century, Relative Distribution by Century, Highest Use by Author, Relative Distribution by Author, Highest Use by Work, and Geographic Distribution.
Raw counts are not always sufficient for comparing usage across centuries or authors, because the amount of surviving text represented in the TLG varies considerably. Relative-distribution charts therefore compare the actual count with an expected count.
The expected value represents how many occurrences would be expected if the lemma were distributed proportionally across the relevant corpus. The difference between the actual and expected values indicates over-representation or under-representation.
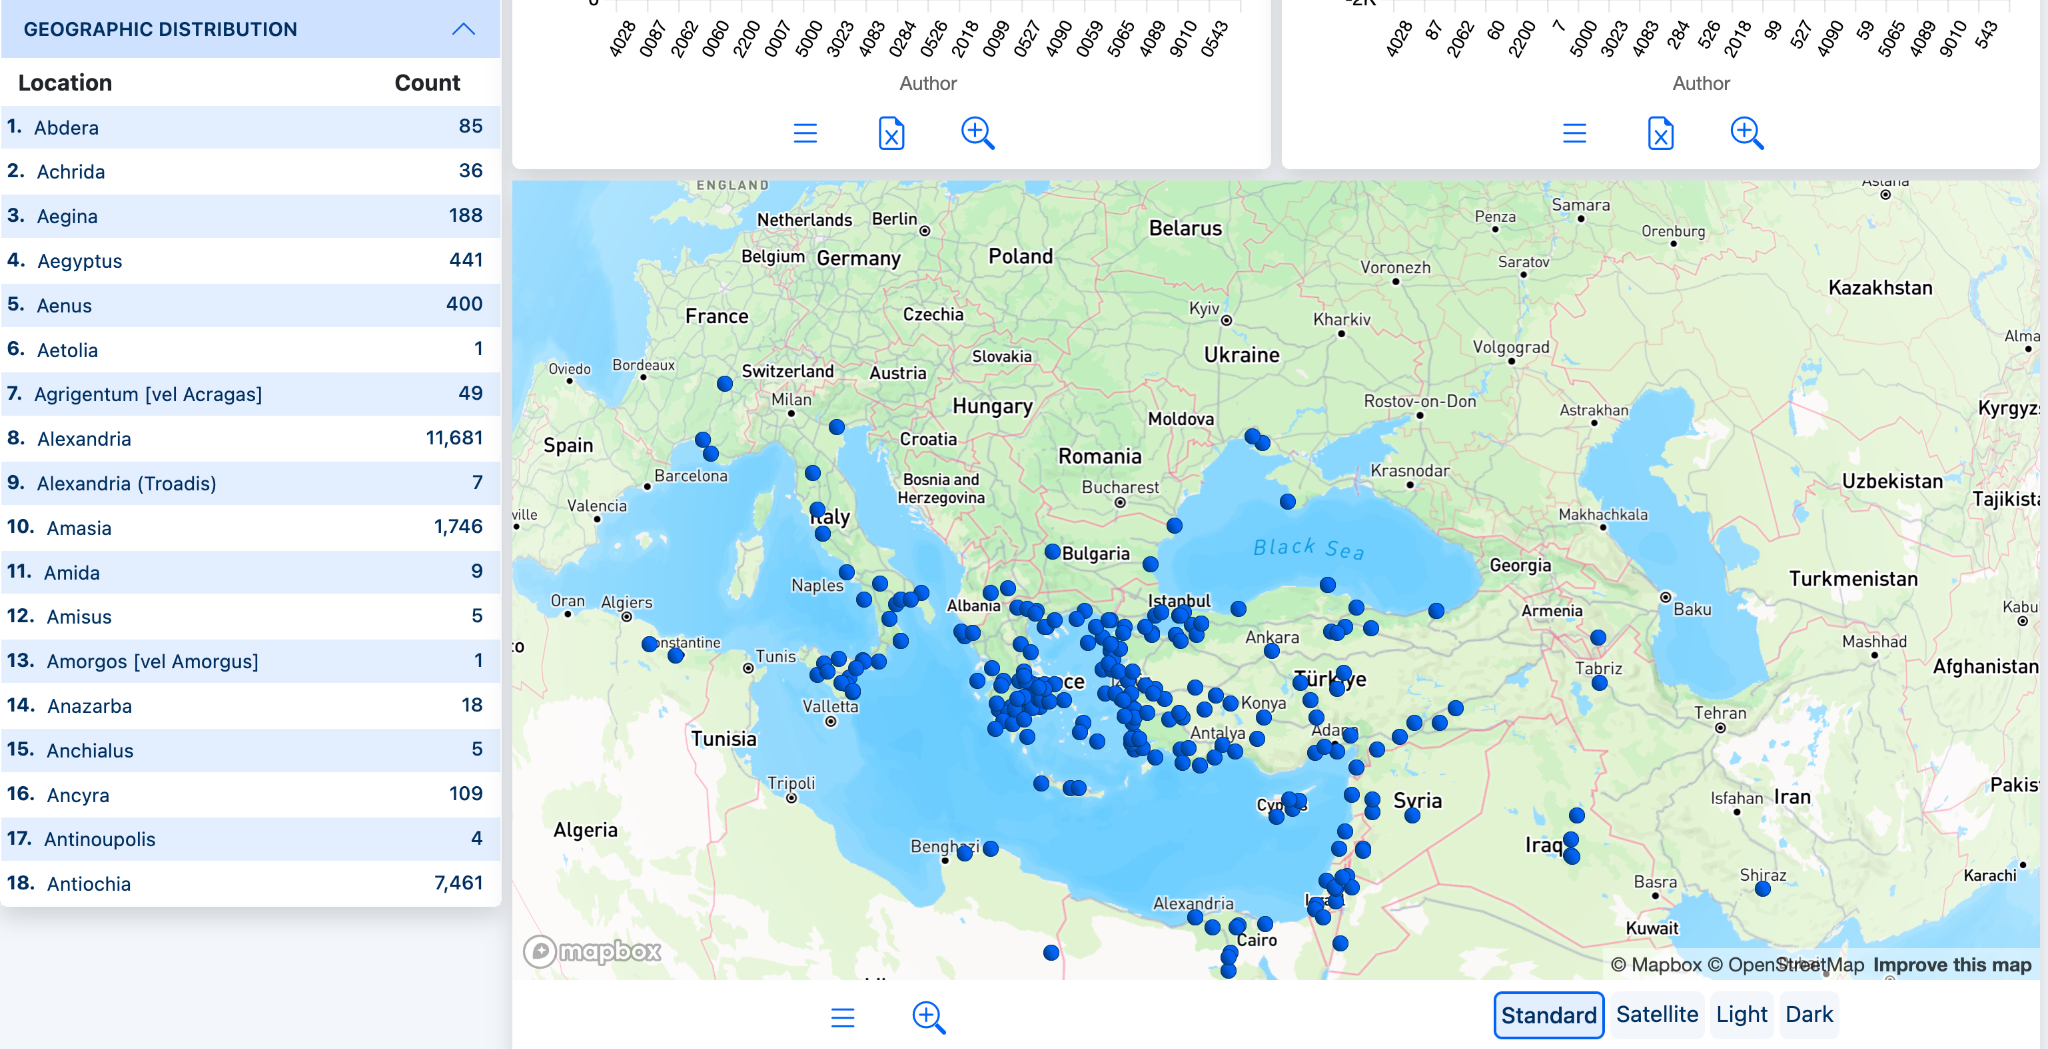
For lemma statistics, expand Geographic Distribution to view attestations associated with geographic locations. The left panel lists locations and counts, while the map plots the corresponding places.
The map can be enlarged and explored interactively. Map display controls allow you to switch among available map views, including Standard, Satellite, Light, and Dark.
Excluded items. Certain lemmata are ignored when calculating lists of the most frequent lemmata in a subcorpus. Stop words are excluded from Statistics, and Milesian numerals are also ignored in statistical lists.
Word totals. The total number of words in the Summary is a raw count and includes non-Greek words. Counts of lemmata and wordforms, and word totals broken down by century, do not include non-Greek words.
Unique occurrences. Statistics identifies lemmata that occur only in a particular author within the TLG corpus. These are described as unique occurrences rather than simply as hapaxes, because the TLG corpus extends beyond the classical literary canon and includes material such as scholia, dictionaries, grammarians, and literary theorists.
Chart controls. Controls beneath charts provide additional ways to inspect the data, including enlarged views and, where available, tabular or downloadable representations.
Full Corpus: overview of the complete or date-limited corpus. Author: vocabulary and distribution statistics for an author or work. Lemma: frequency and distribution of a selected lemma. From / To: chronological limits. Relative distribution: actual frequency compared with expected frequency. Geographic Distribution: location-based display for a lemma.
Statistics are based on the texts and metadata represented in the TLG corpus and should be interpreted in relation to the composition and chronological coverage of that corpus.